


In a typical software system, we monitor our applications using proxies for service health including CPU utilization, Memory Use, Error Count, Latency, and others. This has worked well for configurations that run on an architecture that leverages servers for their compute tier, but it doesn’t work well for serverless architectures.
In recent years, the industry has been steadily moving towards leveraging Serverless technologies for their compute needs. I often refer to these architectures as ‘just in time’ computing. The problem is, serverless applications including AWS Lambda are a different ball game in terms of monitoring the health of our system.
We need to change our approach.
The good news for us is that AWS makes it extremely easy to monitor our Lambda functions. Lambda emits a number of metrics by default through AWS Cloudwatch (the monitoring service in the AWS ecosystem) for free that you can monitor.
In this article, I’m going overview the top X AWS Lambda metrics that you should be monitoring for your application. So lets count down from number X.
#5 – Invocation Count
Invocation count is the most basic metric there is to monitor. It simply corresponds to the number of times your function gets executed.
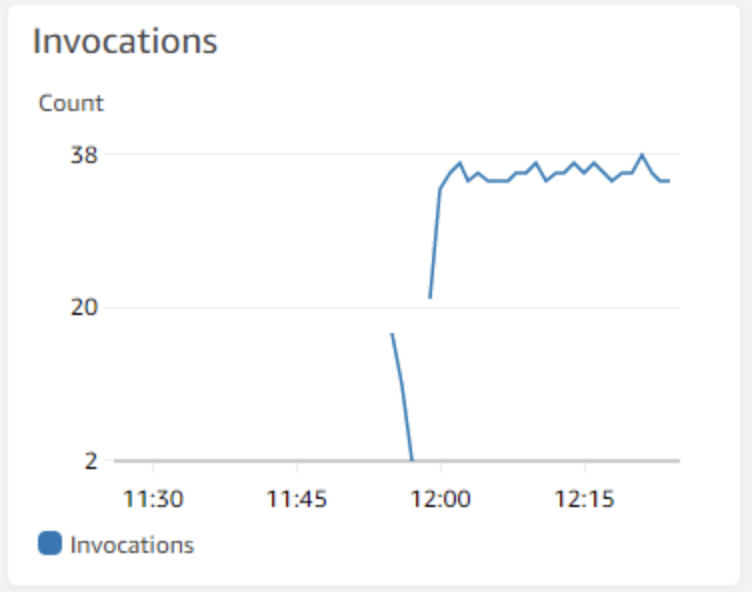
For simple applications such as those that use API Gateway + Lambda, the invocation count will always be 1:1. For other architectures using an Event Source such as SQS, the invocation count indicates the number of times your Lambda function polled the queue.
You may enjoy my other article on How to Learn AWS by Career Paths.
Depending on context, Invocation count can be interpreted in different ways. For applications with typically consistent traffic, a low or zero invocation count can indicate a problem with the system. In other usage patterns such as rare or bursty worklouds, periods of low or no traffic are not a concern at all.
What I’m basically saying is that the pattern that indicates a problem when looking at the invocation metric is typically specific to your application.
#4 – Latency (P50, P90, P99)
Latency is one of the most important Lambda metrics to monitor for both system health, and because it plays such a critical role when computing cost.
Elevated latencies can cause a degraded experience for your customers. Typically, I suggest to not use the default latency metrics AWS provides – this includes Minimum, Average, and Maximum.
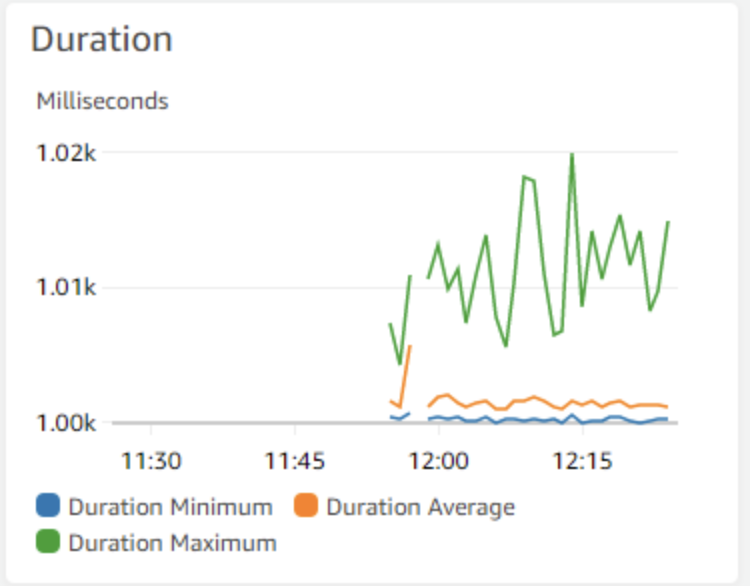
P50, P90, and P99 are much better methods of monitoring latency since they rely on percentile distributions instead of averages, which tend to skew data due to outliers. For a more comprehensive discussion on PXX distributions, check out this excellent medium article on the topic.
I typically use P50 to determine a good baseline for my applications performance, and set up alarms on my P90 metric. P99 and P99.9 are also useful for examining the extreme outliers of your latency distribution.
#3 – Error Count and Percent
High or even elevated error counts can indicate serious problems with a Lambda based application.
Error counts alone aren’t typically enough, though. I like to mix in my error graphs with a percentage of errors line to provide more context. This is useful especially during periods of very high or very low periods of traffic. A high error percentage during a high traffic period is much more serious than during a low traffic period.
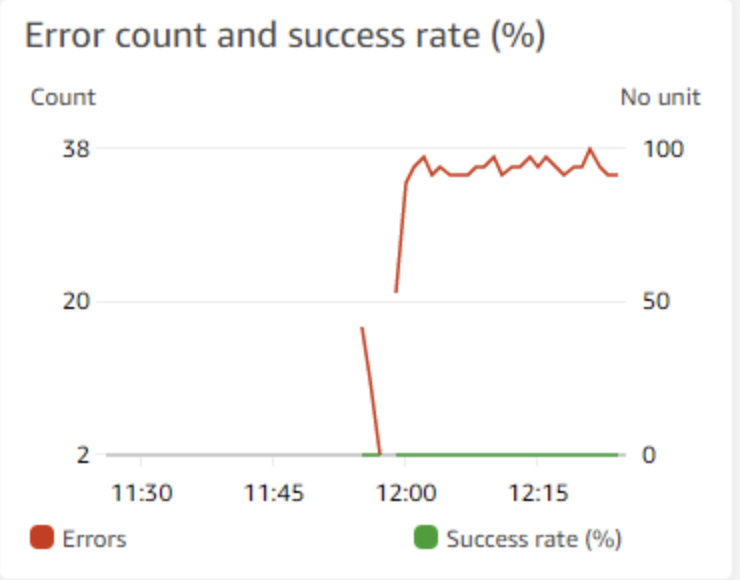
As in the graph above, our Success Count (%) is 0%. The fact that we have error counts near 40 but a success rate of zero percent indicates ALL invocations are failing.
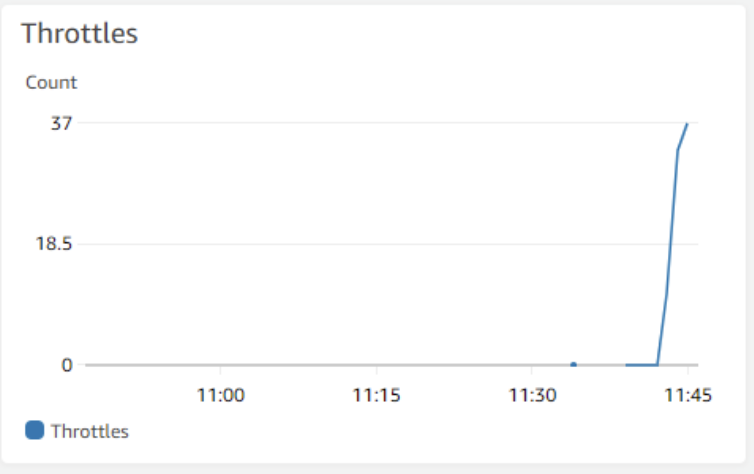
#2 – Throttles
The nature of Serverless computing with Lambda is that we need to be aware of throttles. Throttles are when Lambda rejects an incoming request because they are no concurrency units available. This typically happens when functions undergo periods of high activity, and ‘thrash’ amongst eachother to compete for concurrency amongst the account.
Throttles can be mitigated by setting your concurrency settings appropriately. However, short periods of throttling is not an uncommon sight.
If however, you are seeing sustained periods of throttling in your function, then I would say its time to take a deeper look.
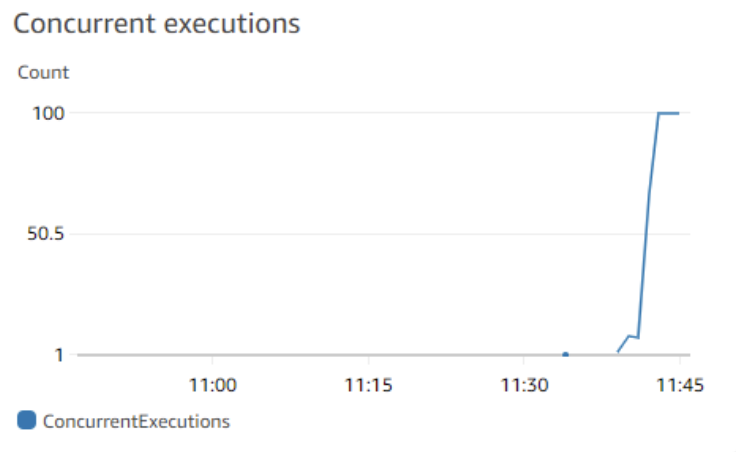
#1 – Concurrent Executions
In Lambda’s concurrency model, a single function can be configured to use reserved concurrency or unreserved concurrency, or a mixture of both.
Reserved concurrency corresponds to a dedicated pool of concurrency a function has access to, for instance, 100 units. This means that at any point in time, there can only ever be 100 in flight requests being made against the function. Any request above this threshold will receive a ThrottlingException.
You may enjoy my other article Is Serverless Taking Over?
You can also configure Lambda to use unreserved concurrency. Using this setting means your function will share concurrent units between other functions in the account that are also using unreserved concurrency.
This may seem fine at face value, but it can cause some serious problems if one function gets a spike in traffic and hogs the concurrency – it can adversely affect other functions in the count.
In light of this, its important to keep an eye on your Concurrent Executions in both cases. When using reserved, be careful you’re not getting too close to your limit or risk being throttled.
If using unreserved, be sure you’re not undergoing spiky invocation patterns to prevent ‘hogging’ resources from other functions in your account.
Regardless though, concurrent executions is an important metric to keep an eye on.
Summary
In this article, we talked about the most important AWS metrics you should be monitoring for your Lambda function.
Always remember that monitoring your applications is a combination of having the right graphs, but also having the write alarms too. Be sure to configure alarms against your Lambda function’s critical metrics to get quickly notified of customer facing issues.


